Gresham Index · Research note #5 · September 2026
We ran every indicator on its own. The most popular one lost to doing nothing.
2026/09/05
The Gresham Index blends seven measurements into one number. The obvious question is whether that is worth the trouble, or whether one good indicator would do the same job. So we tested it: each of the seven, run alone, through the identical pipeline, judged the same way.
How the test worked
Each indicator was turned into a standalone index. Same past-only percentile ranking, same four and eight year windows, same seven day smoothing. The only difference is that one input carries all the weight instead of seven sharing it.
Then all eight indices, the seven singles and the Gresham Index itself, were put through the same four tests:
Did each cycle bottom register as accumulation conditions. Did each cycle top register as distribution conditions. Was the mid cycle peak of June 2019 correctly not flagged as a top. And did the index, driving the same strategy, beat buying a fixed amount every week.
The results
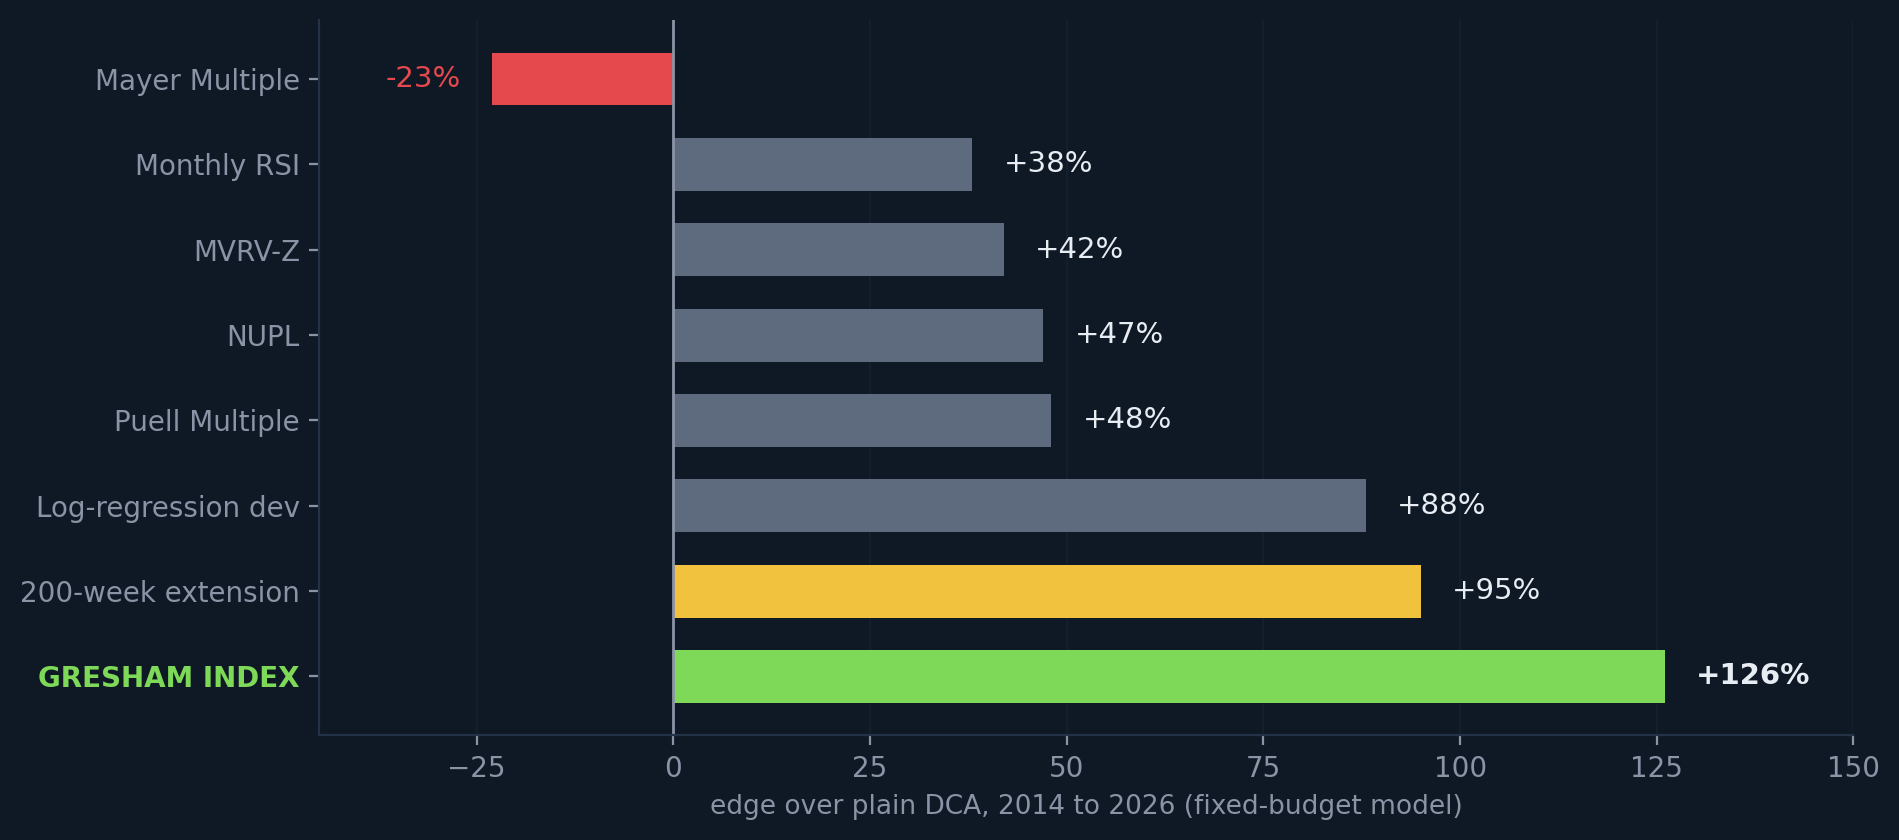
Figure — Each indicator run alone as a strategy, 2014 to 2026, fixed budget model. Grey marks the six that failed at least one test. Red is the one that also lost to plain DCA. Gold is the 200 week extension, the only single indicator that passed everything. Green is the Gresham Index, which blends all seven.
| Run alone | 2015 bottom | 2018 bottom | 2022 bottom | Jun 2019 | vs plain DCA |
|---|---|---|---|---|---|
| Mayer Multiple | 0.06 | 0.02 | 0.16 | 0.92 | −23% |
| Monthly RSI | 0.01 | 0.05 | 0.06 | 0.53 | +38% |
| MVRV-Z | 0.05 | 0.01 | 0.04 | 0.76 | +42% |
| NUPL | 0.06 | 0.02 | 0.04 | 0.79 | +47% |
| Puell Multiple | 0.03 | 0.01 | 0.09 | 0.80 | +48% |
| Log-regression deviation | 0.00 | 0.33 | 0.06 | 0.61 | +88% |
| 200-week extension | 0.00 | 0.04 | 0.00 | 0.58 | +95% |
| Gresham Index (all seven) | 0.03 | 0.07 | 0.06 | 0.69 | +126% |
Readings below 0.30 mean accumulation conditions, so the bottom columns should be low. June 2019 was not a cycle top, so that column should also be low. Anything at 0.75 or above in that column is a false alarm.
The most cited indicator is the worst one
THE MAYER MULTIPLE — Price against its own 200 day average. It is probably the most quoted Bitcoin valuation measure there is. Run on its own over the full period, it finished 23% behind simply buying a fixed amount every week and ignoring it entirely. It also produced the most confident false top of the whole test, reading 0.92 in June 2019.
Bitcoin rose more than fivefold after June 2019. An indicator that says sell at that point does not merely fail to help. It costs money.
Mayer was not alone in that. MVRV-Z read 0.76, NUPL 0.79, Puell 0.80. Four of the seven called a top that did not exist. The Gresham Index read 0.69 and stayed out of the distribution zone, because monthly RSI was at 0.53 and the slower price measures were nowhere near an extreme. Requiring several kinds of evidence to agree is what kept it out.
The awkward result
One indicator passed every test. The 200 week extension, price against its own 200 week average, identified all three bottoms, avoided the 2019 false alarm, and returned 95% over the period. It is the only single indicator in the set with a clean record.
WHY THIS DOES NOT MEAN USE THAT ONE — We know it survived because we are looking backwards. Standing in 2014 there was no way to tell which of the seven would come through clean, and six of the other candidates would have hurt you at some point. Picking the survivor after the race is not a method. It is the same error as tuning a strategy until the backtest looks good, and we refuse it here for the same reason we published settings that rank fourteenth out of eighty one rather than first.
The Gresham Index needed no such choice. It worked in every cycle without anyone having to guess correctly in advance, and it beat the survivor by a third.
What this does not prove
Seven indicators is not obviously the right number. Two or three might do nearly as well, and we have not tested every combination. What the test shows is narrower: that no single one of these seven was reliable on its own, and that the one that was reliable could not have been identified in advance.
It is also one asset over one period. Twelve years is three cycles, which is a small sample for a claim about cycles. We publish the number of cycles rather than dressing it up as a longer record.
Reproduce it
The script that produces this table is public, along with the full series and the frozen specification. It takes the same seven indicators, runs each one alone through the same code path, and prints the results. If you disagree with the judges we used, change them and run it again.
Historical simulation of the frozen v1.0.1 specification, 2014-01 to 2026-05. Fixed budget model: identical money committed on an identical schedule, only the timing of deployment differs. Past results do not indicate future performance. Informational and educational only, not investment advice. Crypto assets are volatile; never commit money you cannot afford to lose.
Data: Coin Metrics Community Data, licensed under CC BY-NC 4.0. Modified: transformed into derived indicators and percentile ranks.