Gresham Index · Research note #7 · September 2026
Below 0.50, the next twelve months gave a median +94%
2026/09/25
The Gresham Index is one number between 0 and 1 that says how expensive bitcoin looks against its own history. Low means cheap, high means stretched. This note asks the obvious next question: after each reading since 2014, what did the price actually go on to do?
What we measured
For every trading day from 1 January 2014 to today, we took the index reading on that day and then looked up the bitcoin price one month, three months, six months and twelve months later. That gives 4,650 days, of which 4,285 have a full year of price history after them.
Nothing here is a strategy. There is no buying, no selling and no fees. It is one question asked over and over: given what the index said on a day, what did the price do afterwards?
The first finding: the index is a statement about the year, not the month
At one month there is almost nothing to see. Low readings were followed by a median gain of 2.3%, high readings by 0.3%, and all days together by 2.2%. Slightly more than half of every group ended higher. If you are looking for a reason to trade next week, this is not it.
Stretch the window and the groups pull apart. By twelve months the gap is more than a hundred percentage points.
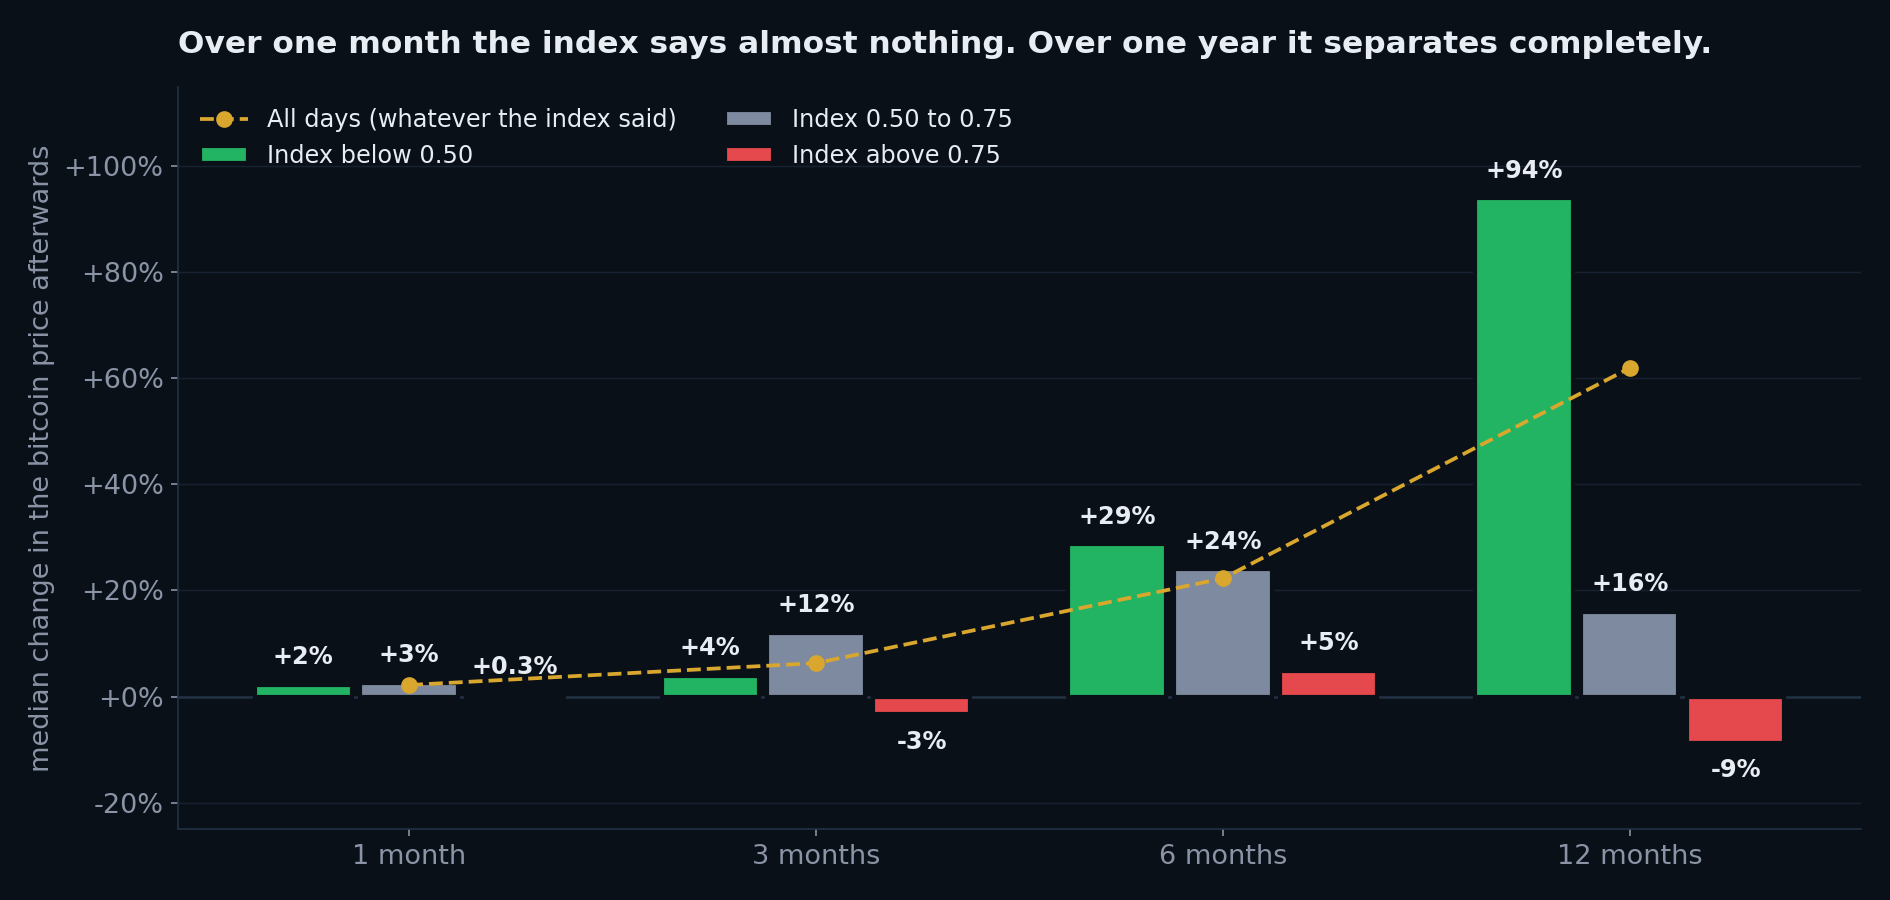
Figure — Median change in the bitcoin price after each reading group, by how far ahead you look. The gold line is every day in the sample, which is the honest benchmark: bitcoin rose over most twelve-month windows since 2014, so the question is never "did it go up" but "did it go up more than usual".
| Reading on the day | 1 month | 3 months | 6 months | 12 months | Days |
|---|---|---|---|---|---|
| Below 0.50 | +2.3% | +3.9% | +28.7% | +93.9% | 2,374 |
| 0.50 to 0.75 | +2.6% | +12.0% | +24.0% | +15.9% | 1,330 |
| Above 0.75 | +0.3% | -3.3% | +4.9% | -8.7% | 581 |
| All days | +2.2% | +6.3% | +22.3% | +61.9% | 4,285 |
The middle band is worth a moment. Over three and six months it looks perfectly healthy, better than the low band. Only at twelve months does it fall behind, and that is because mid readings occur both on the way up and on the way down. The index is least informative exactly where it is least certain, which is the behaviour you want from a measurement.
The second finding: the ordering holds, the fine detail does not
Split the readings into tenths and the slope is clear. Every tenth below 0.50 was followed by a median gain between 64% and 124%. Every tenth above 0.70 was followed by a median near zero or below.
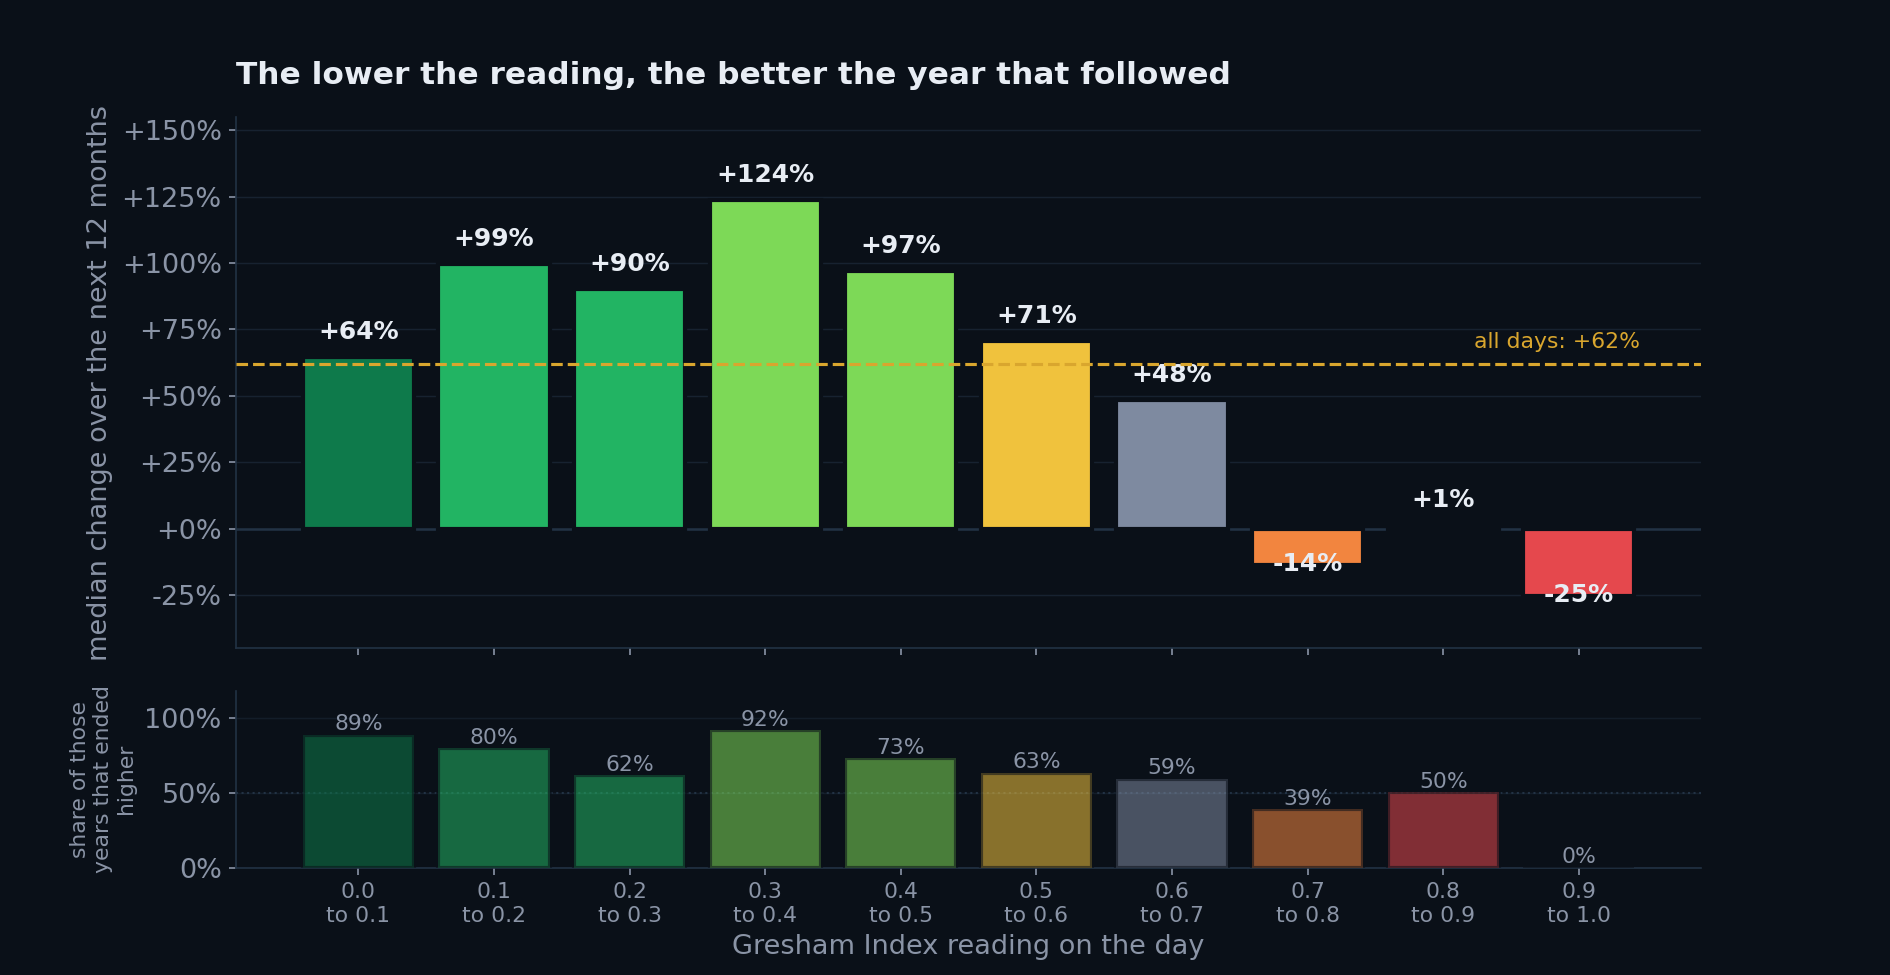
Figure — Top: median change over the following twelve months, grouped by the reading on the day. Bottom: how often those twelve months ended higher. Sample sizes per group run from 259 to 661 days, except the top group (0.9 to 1.0), which has only 49 days and comes from a single episode in early 2021.
What the chart does not support is reading the index to two decimal places. The 0.1 to 0.2 group did better than the 0.2 to 0.3 group. The 0.8 to 0.9 group did better than the 0.7 to 0.8 group. Those reversals are noise, and anyone who builds a story around them is fitting the past. The finding is a tilt across the whole range, not a value for each step.
The third finding: how often it was wrong, and when
Counting days flatters any result, because the days overlap. The 2,374 low readings are not 2,374 independent observations. They are nine separate stretches. So we scored the stretches instead.
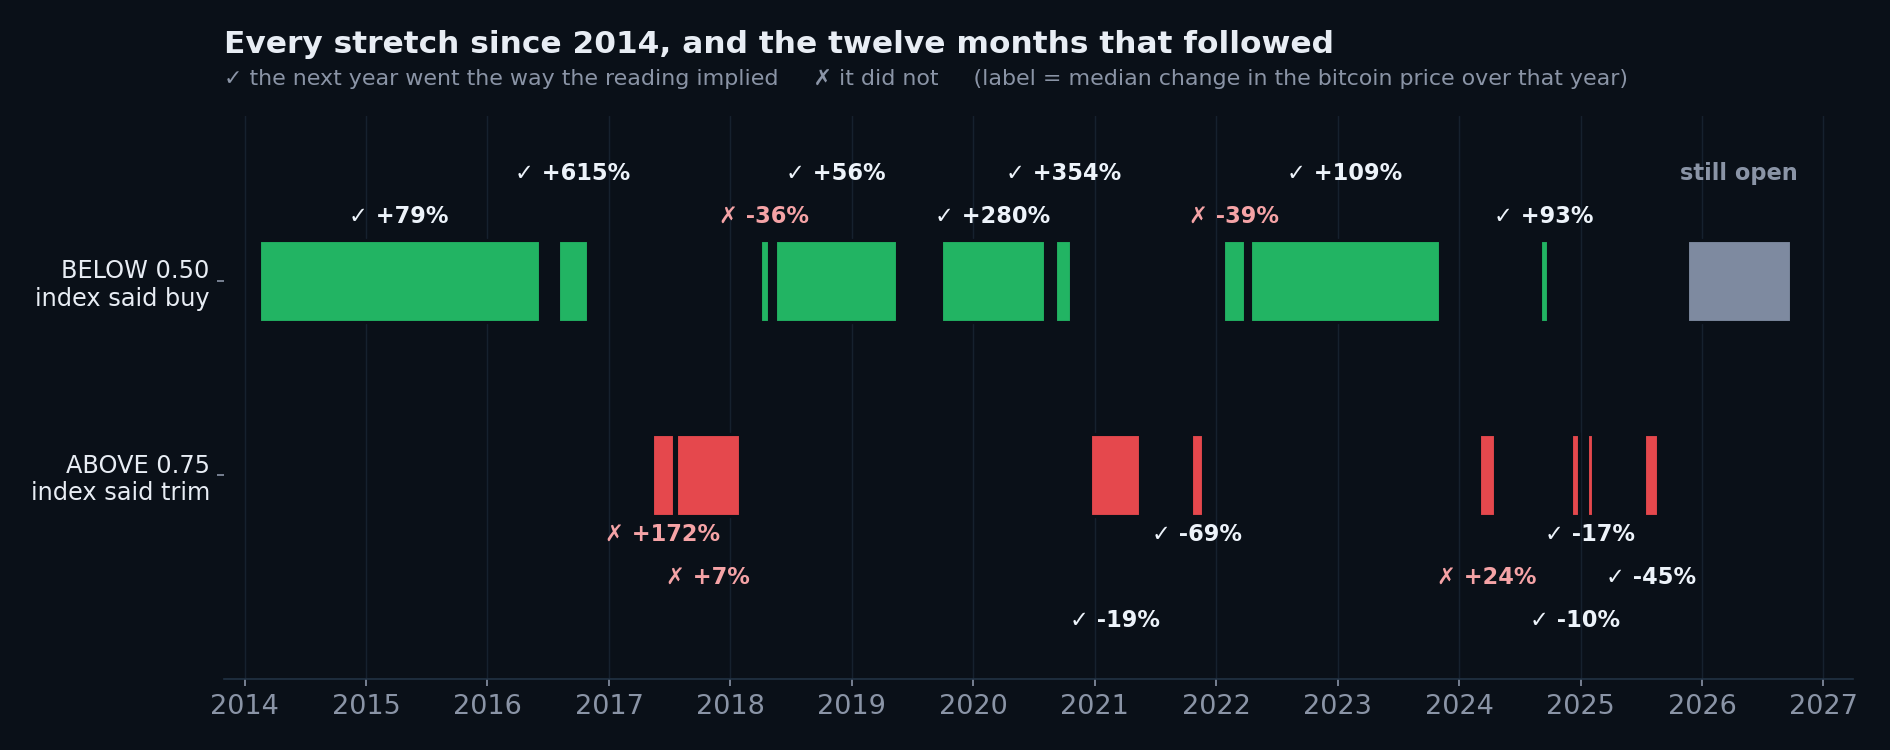
Figure — Each continuous stretch of at least two weeks below 0.50 or above 0.75 since 2014, with the median change in the bitcoin price over the twelve months that followed. The current stretch, which began in November 2025, cannot be scored yet.
THE RECORD, STRETCH BY STRETCH — Twelve of seventeen scored stretches were followed by the kind of year the reading implied. On the buy side, seven of nine. On the sell side, five of eight.
The misses are more useful than the hits, because they repeat.
Low readings failed early in bear markets. Of the 2,374 low-reading days, 466 were followed by a lower price a year later, and they sit in three places: all of 2014, April and May 2018, and the first half of 2022. In each case the index was correctly saying bitcoin was cheap, and bitcoin then got cheaper for months. Cheap is not the same as finished falling.
High readings failed during blow-offs. Of the 581 high-reading days, 269 were followed by a higher price a year later: May to November 2017, December 2020 to February 2021, and March to April 2024. A reading above 0.75 means conditions look stretched. Stretched markets can stretch a great deal further, and 2017 is the extreme case: the index sat above 0.75 from 9 May, apart from six days in July, while the price top did not arrive until 16 December.
This is the same asymmetry the strategy is built around. It is why we trim in small weekly slices rather than selling out at a threshold, and why the accumulation multipliers keep buying rather than waiting for a bottom to be confirmed.
How much to trust any of this
Three cycles. Seventeen stretches. That is the entire sample, and no amount of daily granularity changes it. The correct way to read the twelve-month numbers is as a rough tilt observed three times, not as a probability.
A second caution: the sample covers a period in which bitcoin rose from roughly $750 to roughly $84,000. In a flat or falling decade every number in this note would look different, including the benchmark. What survives such a decade is the ordering between the groups, and the ordering rests on three observations.
WHAT THIS NOTE DOES NOT SAY — It does not say the next twelve months will be positive. One year in five following a low reading ended lower, and the worst of them ended 66% down. It does not give a target, a date or a probability. It describes what has happened before, on a sample small enough to be wrong.
Where that leaves today
The index is at 0.42, in the Accumulation zone, and has been below 0.50 since 18 November 2025. Historically that has been the better half of the range to be buying in, by a wide margin, and it has also been the half where the index has looked wrong for months at a time before being right.
Both halves of that sentence come from the same data, and we would rather publish both.
Method: daily Gresham Index values and bitcoin closes from 2014-01-01 to 2026-09-24. Forward returns measured at 30, 91, 182 and 365 calendar days. Readings before 2014 exist in the archive but are excluded from every figure here, because the percentile windows behind the index need several years of history before they mean anything. No strategy, trading or fees are modelled.
Data: CoinMetrics Community (CC BY-NC 4.0). Informational and educational only, not investment advice. Past behaviour does not guarantee future results. Invest only what you can afford to lose. An independent project from Slovakia.