Gresham Index · Research note #4 · August 2026
The index just crossed 0.30. Here is what happened the last eight times.
2026/08/27
On 25 August the Gresham Index closed at 0.3045 and moved from Strong Accumulation into Accumulation. Bitcoin has risen 28% in under two weeks and people are asking whether the bottom is in. We are not going to answer that. But we can show what the record says about this exact event.
The event
The index runs from 0 to 1. Crossing up through 0.30 means leaving Strong Accumulation and entering Accumulation, which is the point where our published rules cut a saver's deposit from 2× their base amount to 1×. It is the clearest single move this metric makes, so it is worth knowing what usually follows.
Since 2014 it has happened nine times, counting the current one. We only count crossings that came after at least 30 days below the line, so short flickers back and forth are excluded. We start at 2014 because that is the first date all seven indicators are fully warmed up; the 200 week average and the log regression each need years of prior history, and readings before then are not ones we consider valid.
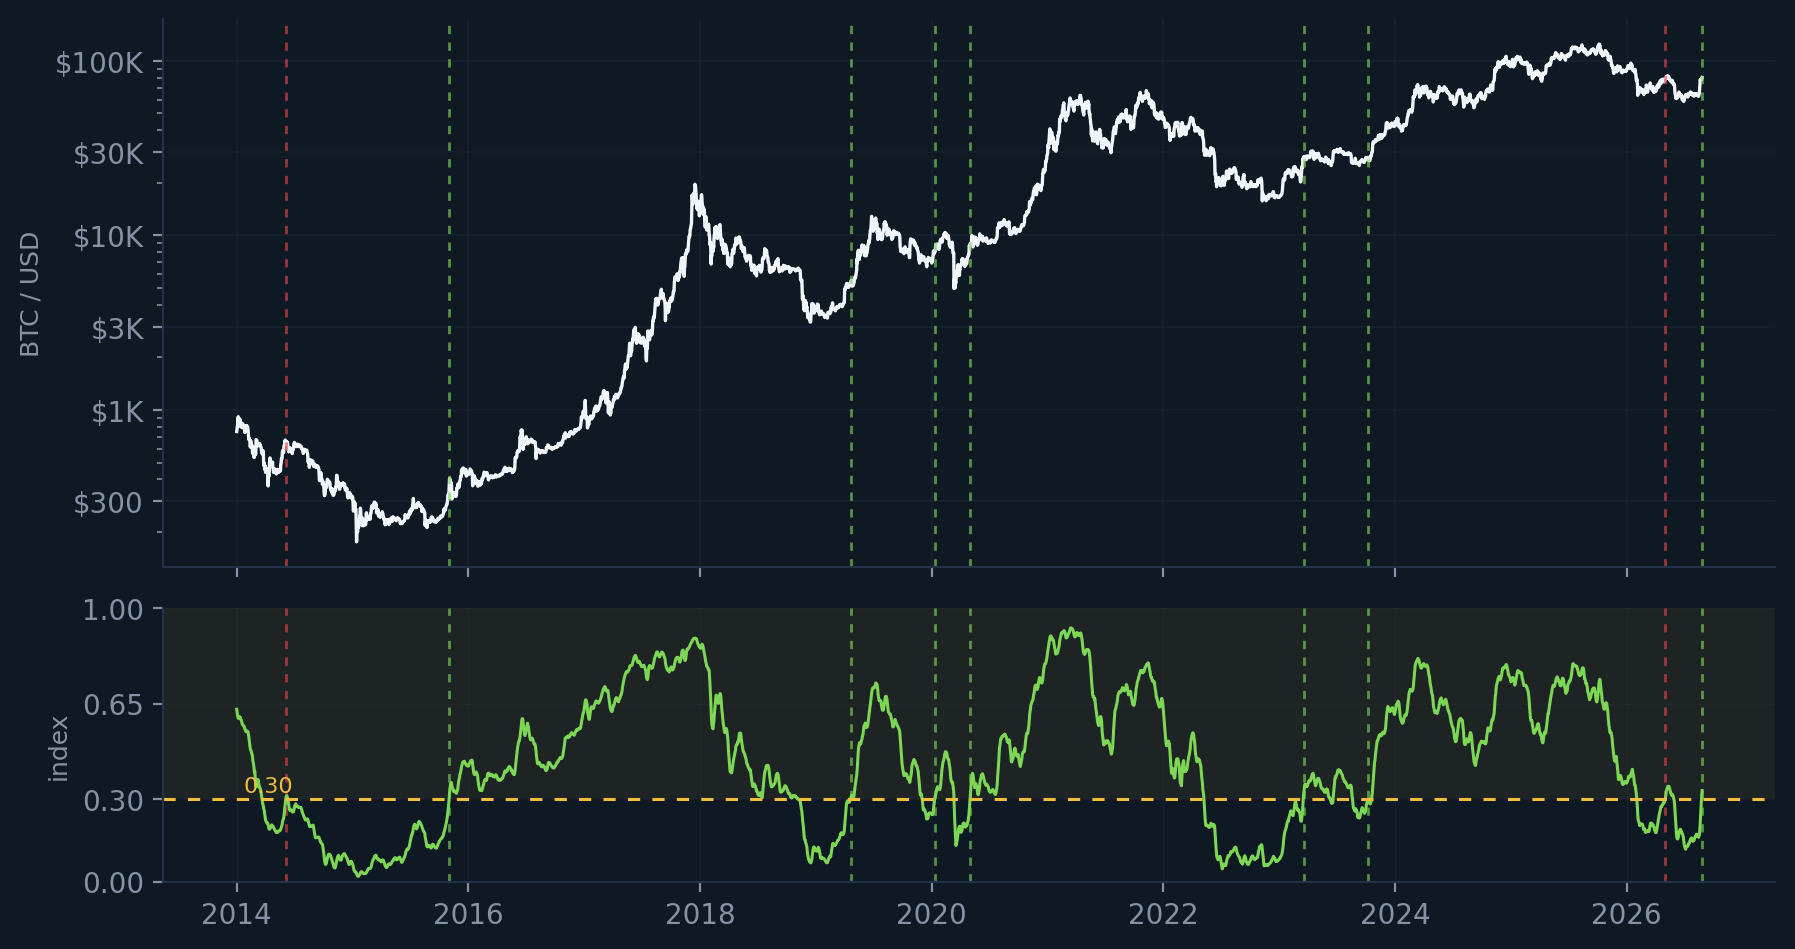
Every crossing marked on price and on the index. The two marked in red are the ones that did not hold. The dashed line on the lower panel is 0.30.
The record
| Crossed | BTC price | Days above 0.30 | Price one year later |
|---|---|---|---|
| Jun 2014 | $662 | 7 | -66% |
| Nov 2015 | $365 | 1,103 | +100% |
| Apr 2019 | $5,296 | 226 | +29% |
| Jan 2020 | $8,032 | 61 | +377% |
| May 2020 | $8,977 | 737 | +530% |
| Mar 2023 | $28,185 | 86 | +140% |
| Oct 2023 | $27,936 | 2 | +123% |
| May 2026 | $78,713 | 29 | too early to say |
| Aug 2026 | $78,601 | 3 so far | — |
Six of the seven finished cases were higher a year on, with a median gain of 123%. That sounds like a strong signal. Before treating it as one, read the next two sections.
We already crossed this year, and it did not hold
On 2 May 2026 the index went above 0.30 and stayed there for 29 days, reaching 0.348. Then it fell back. By July it was at 0.118 and Bitcoin had dropped to $58,500. So this is not a fresh signal off a long base. It is the second attempt in four months.
That matters because the sample of nine is not nine independent events. Two of them happened this year, three months apart, in the same market. If the current one fails the way May did, the honest reading is that the index has been oscillating around this line rather than confirming anything.
What separated the failure from the rest
June 2014 is the one clear failure. It crossed at $662, spent seven days above the line, dropped back, and was 66% lower a year later.
The obvious thing that marks it out is how briefly it held. The crossings that worked out mostly stayed above 0.30 for months: 1,103 days in 2015, 226 days in 2019, 737 days in 2020. The 2014 failure held seven days. May 2026 held 29.
October 2023 held for only two days and was still 123% higher a year later. So a short stay above the line is not proof of anything on its own. With seven completed cases and one clear failure, there is not enough here to build a rule from, and we have not built one.
Today is day three above the line.
What we are not saying
We are not saying the bottom is in. The index does not forecast. It reports where the market sits against its own history, and right now that reading is 0.33, which is the low end of normal rather than cheap.
It is also worth remembering that this metric missed the exact top in October 2025, printing 0.729 when the cycle peaked. We published that at the time and it is still in the record. A metric that got one turn wrong is not a metric to build certainty on.
What changes in practice is small and mechanical. Under our published rules, a reading between 0.30 and 0.50 means a saver following Smart DCA moves from depositing 2× their base amount to 1×. Nothing else changes. No exit, no call, no target.
Check it yourself
Every reading in this note comes from the public series. The daily record has been published since 13 July 2026 and cannot be edited quietly. Everything before that is a reconstruction under the same frozen rules, using only data available on each day.
Historical simulation of the frozen v1.0.1 specification, 2014 to 2026. Past results do not indicate future performance. Informational and educational only, not investment advice. Crypto assets are volatile; never commit money you cannot afford to lose. Data: Coin Metrics Community Data, licensed under CC BY-NC 4.0. Modified: transformed into derived indicators and percentile ranks.