Gresham Index · Research note · July 2026
We backtested 37,072 market scenarios. Here is how risk-guided DCA compares to plain DCA.
2026/07/01
Every possible start day since 2014. Every quarterly evaluation date. Two strategies against the most honest benchmark there is — buying on a fixed schedule, no matter what. Full methodology, including our losing scenarios, below.
The question
Dollar-cost averaging — buying a fixed amount of bitcoin on a fixed schedule — is the most sensible strategy most people will ever use, and it is our benchmark throughout. The question we set out to answer: if a saver keeps the same schedule but lets a market-cycle risk score guide how much to buy — and, in the full version, when to take profit — does the outcome improve? And does it improve reliably, or only from lucky starting points?
The three strategies
| Plain DCAthe benchmark | Smart DCA strategynever sells | Full Cycle strategythe complete cycle | |
|---|---|---|---|
| Deposits | Fixed amount, every period | Base × risk multiplier (3×/2×/1×/0.5×/0) | Identical to Smart DCA |
| Selling | Never | Never | Small weekly tranches (1.5%/4%) in high-risk zones |
| Proceeds | — | — | Stay in the balance as cash; redeploy in low-risk zones |
The risk score — the Gresham Index — is a composite of seven indicators (price-trend, on-chain valuation and momentum families), computed strictly from past data at every point — no lookahead — under a frozen, published methodology (spec v1.0.1). The outcome metric is the simplest one: final balance per dollar deposited, at a common evaluation date.
Methodology: every start, every judgment date
A single backtest proves little — its start and end dates can flatter any strategy. We therefore ran two exhaustive sweeps on daily data from 2014-01-01 (the first date all indicators have sufficient history) through 2026-05: (1) a strategy launch on every single calendar day from 2014 to mid-2026 — 4,161 starts, all evaluated at the same final date; and (2) every combination of those start days with every quarter-end evaluation date at a minimum one-year horizon — 32,911 start×end pairs, which also captures how the strategies look when judged mid-cycle, at the worst possible moments. Weekly execution; identical rules everywhere; no parameter was fitted to any individual window.
Results
| Every start day (n=4,161) evaluated May 2026 | Every start × end pair (n=32,911, ≥1y horizon) | |
|---|---|---|
| Smart DCA vs plain | beats plain: 88.2% median ROI ratio 1.38× worst start 0.84× | ahead in 85.3% of pairs median 1.31× |
| Full Cycle vs plain | beats plain: 100.0% median 1.65× · mean 2.01× worst start 1.10× · best 4.36× | ahead in 97.3% of pairs median 1.57× · 5th pct 1.07× |
Return on deposited money vs plain DCA, for every possible start day (evaluated May 2026)
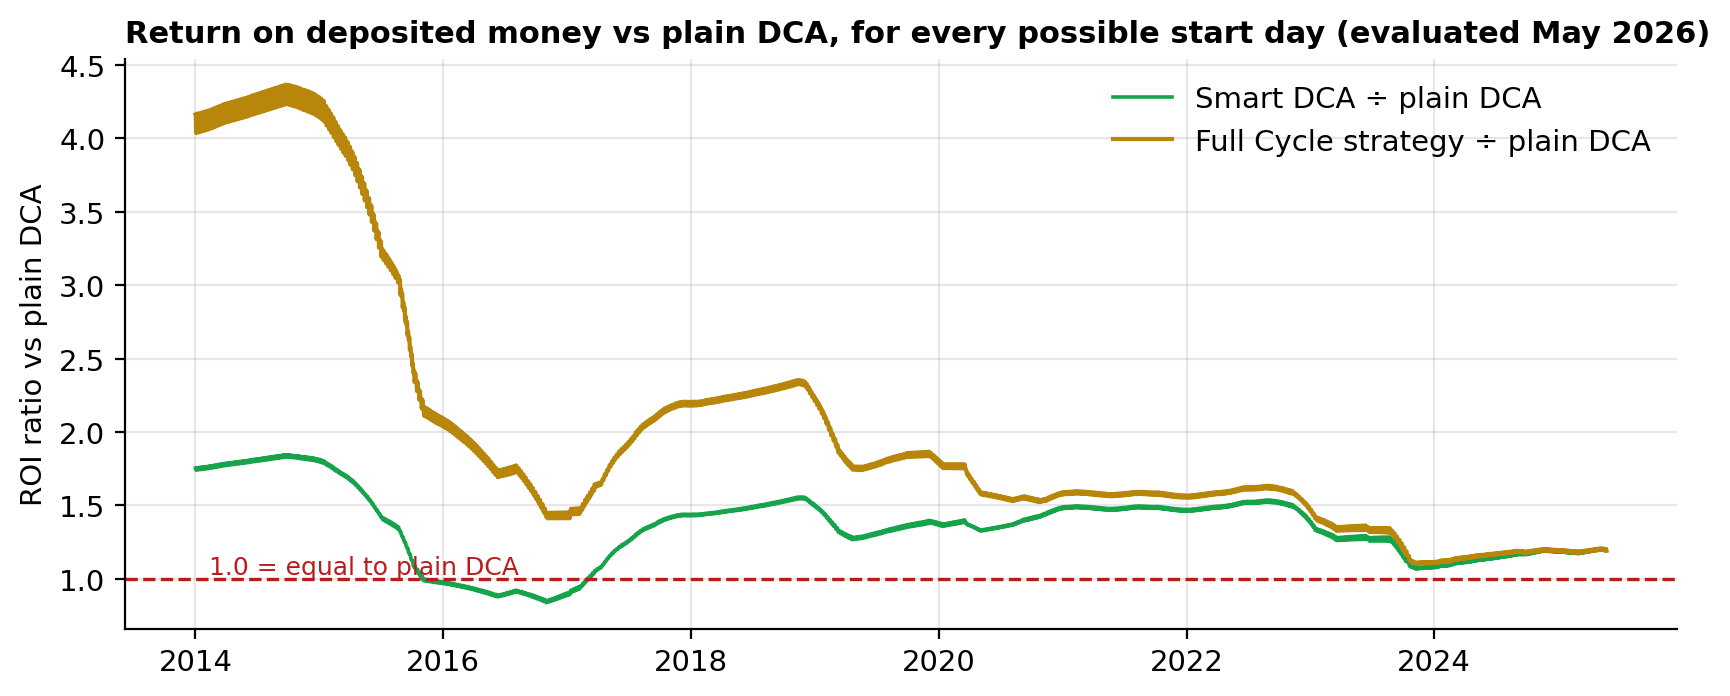
Figure 1 — ROI relative to plain DCA for a strategy launched on each of the 4,161 possible start days, all evaluated May 2026. The Full Cycle line never crosses below 1.0; Smart DCA dips below only for starts in late 2015–early 2017.
The edge grows with time invested (median across all start dates)
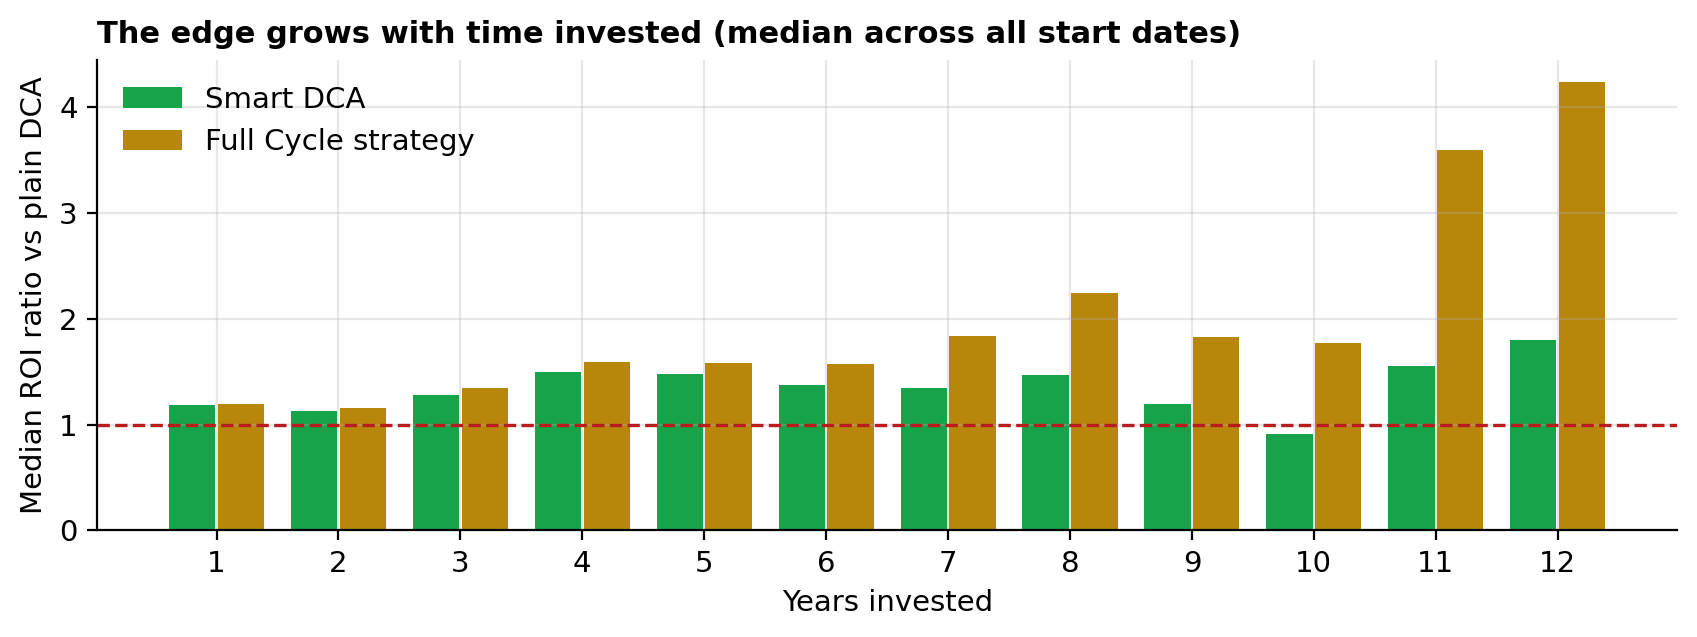
Figure 2 — The advantage compounds with time invested: roughly +20% after one year, +60% around five years, and 4× for the longest histories (Full Cycle strategy, median across all start days of a given horizon).
The scenarios we lost — published, not hidden
The Full Cycle strategy lost to plain DCA in 890 of 32,911 start×end pairs (2.7%). Every one of them tells the same story: a strategy started around the 2017 mania and judged before the following cycle completed — worst case, a start in April 2017 evaluated in June 2018 at 0.54×. The mechanism is structural and disclosed: the strategy sells tranches into euphoria and needs the subsequent accumulation phase to redeploy them; judged in between, it trails. Notably, there is not a single losing pair at any evaluation date after December 2021 — every cohort, judged at any quarter-end in the last four and a half years, is ahead of plain DCA. Smart DCA's losing starts cluster analogously (late 2015–early 2017, worst 0.84×). We publish these because a backtest that cannot lose is a backtest you should not trust.
Limitations, stated plainly
Three cycles. Bitcoin has existed through roughly three full market cycles since 2014; our 37,072 scenarios are fine slices of that history, heavily overlapping — they are not 37,072 independent experiments. Deposits differ by design. The smart strategies deposit base × multiplier, so total deposits differ from plain DCA's; return-per-dollar-deposited is precisely the metric that makes this comparable, and each simulator discloses the totals. Mid-cycle patience is required. During euphoria phases the Full Cycle strategy will trail — that is when it is selling; the matrix quantifies how often (roughly one evaluation quarter in four historically, vs its never-selling variant). Past is not future. All results are historical backtests of frozen rules; a structurally different future (e.g. a decade-long melt-up without corrections) would reduce or remove the advantage — our separate stress-test battery quantifies those regimes. The complete methodology, formulas, test vectors and the full validation record — including every rejected improvement — are published in specification v1.0.1.
This document is informational and educational only and is not investment advice or a recommendation to buy or sell any asset. Backtested performance does not guarantee future results. Crypto-assets are highly volatile; invest only what you can afford to lose.