Gresham Index · Research note #3 · August 2026
We missed the 2025 top. But at the same time the average exit price was 92 % of the top.
2026/08/04
On 6 October 2025 Bitcoin printed its cycle high at $124,824. The Gresham Index read 0.729 that day — inside the Neutral band, outside the distribution zone entirely. By the strictest reading, the instrument did not identify the top.
We publish this because a metric that only shows its hits is not evidence of anything. But the interesting part is not the miss. It is what the index did instead, and what the miss reveals about a change in Bitcoin itself.
What the index did instead
The strategy does not wait for a single day. It sells small weekly tranches for as long as conditions stay elevated, and in 2025 those conditions ran from 22 January to 20 August — eight selling weeks, ending seven weeks before the peak.
Across that window it sold 9.35 BTC at a volume-weighted average of $114,295. The eventual top was $124,824. The strategy therefore exited at 92% of a price it never identified.
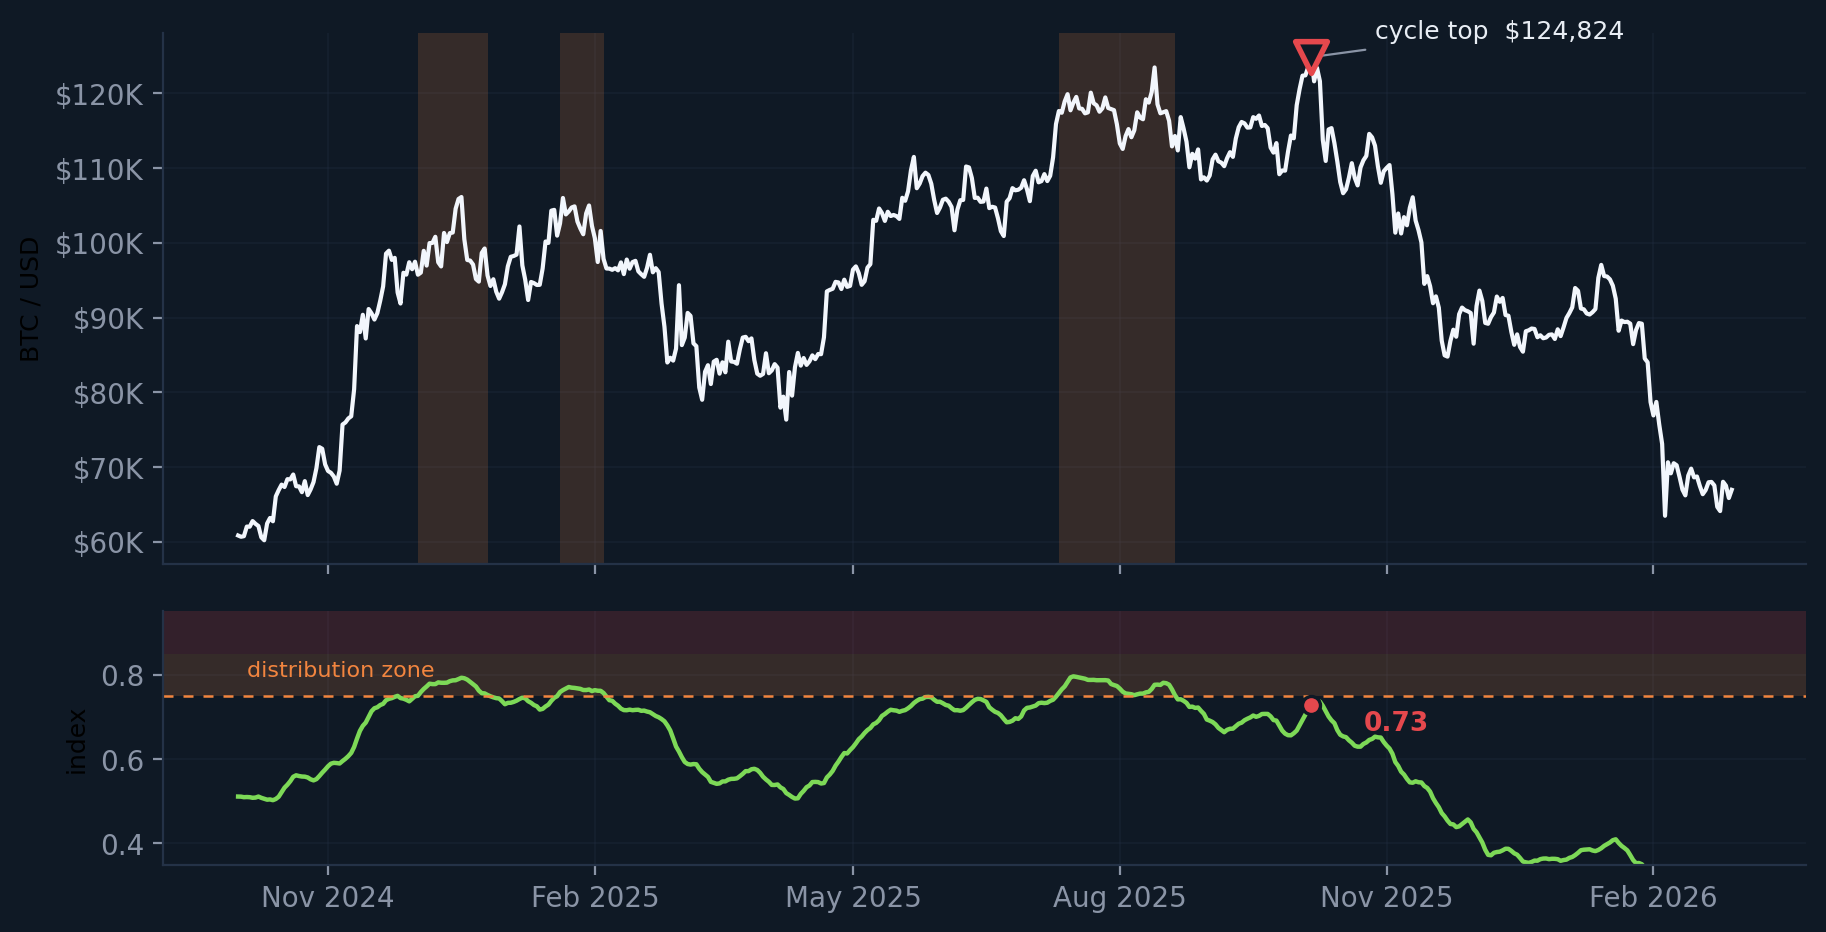
Shaded bands mark days in the distribution zone. The cycle top falls outside them — seven weeks after the index last read above 0.75. Backtest under frozen v1.0.1 rules; data through 2026-05. Prices from Coin Metrics Community Data.
Set against the two previous cycles, this was not a degradation. It was the best exit the index has produced.
| Cycle | Selling weeks | Avg sale price | Share of the top | Peak reading |
|---|---|---|---|---|
| 2017 | 38 | $7,364 | 37% | 0.889 |
| 2021 | 26 | $48,262 | 71% | 0.926 |
| 2025 | 8 | $114,295 | 92% | 0.815 |
Exit quality improved in every cycle, and improved most in the cycle where the index read the peak least accurately. The two facts are not in tension: the instrument describes seasons, and the season was read correctly even though the day was not.
Why the reading was low
The index ranks each day against Bitcoin's own history. That makes it self-calibrating across price regimes — but it also means a peak is scored relative to every previous peak, including the manias of 2013 and 2017.
Those manias were far larger. Measured bottom to top, the three completed cycles gained 111.8×, 21.2× and 7.9×. Amplitude has compressed by roughly an order of magnitude in a decade, and the peak readings fell with it. The 2022–2025 cycle never once entered the deepest band — not for a single day.
The highest value of the entire cycle was 0.815 on 14 March 2024 — eighteen months before the actual peak, at roughly half the eventual price. The index was at its most cautious at a moment that was not the top. A metric built to call tops would treat that as a serious error. A metric built to describe conditions treats it as what it is: March 2024 genuinely was an overheated moment, and it was followed by a twelve-month drawdown before the trend resumed.
What we are not doing about it
We could make the 2025 top read red tomorrow. Lowering the distribution threshold from 0.75 to 0.70, or shortening the comparison window so the older manias age out faster, would both do it. Either change would make the historical chart look considerably better.
Retuning a threshold because the most recent cycle disappointed us is the definition of fitting a model to the past. It is the same error as selecting the best of eighty-one tested variants — which we also declined, publishing settings that rank fourteenth instead. A specification that changes whenever it is embarrassed is not a specification.
The rules are frozen at v1.0.1. Changing them requires a new version number, a published justification, and evidence gathered after the change is proposed — not a quiet edit that improves a backtest.
What would change our minds
If amplitude compression continues, the top of the scale will be used less and less, and eventually the index would be describing a range the market no longer visits. That is a real possibility, and it is measurable: we now have three cycles of declining peak readings — 0.889, 0.926, 0.815 — and one cycle that never reached the deepest band.
Three observations are not a trend. A fourth cycle behaving the same way would be a strong argument for recalibration, and that argument would be made in public, with the reasoning and the out-of-sample evidence attached, at a version boundary. Until then the instrument stays as specified — including the part of it that got 6 October 2025 wrong.
The index did not identify the 2025 top, and under the current rules it would not identify a similar one. What it did was recognise seven months of elevated conditions and sell into them at 92% of a price it never named. Whether that is good enough is a judgement each reader should make with the numbers in front of them — which is why they are all here.
Backtested results under the frozen v1.0.1 specification, committed-saver and fixed-budget models as labelled, 2014-01 to 2026-05. Historical results do not indicate future performance. Informational and educational only — not investment advice. Crypto-assets are highly volatile; never commit money you can't afford to lose.
Data: Coin Metrics Community Data, licensed under CC BY-NC 4.0. Modified: transformed into derived indicators and percentile ranks.